Moving up the ranks: how fleets can use the latest advancements in driver scorecards
By Verlen Larson
Motor carriers accumulate vast amounts of driver data from vehicle telematics, cameras, IoT sensors and back-office software systems. The sheer volume of data is both a challenge and opportunity.
Solving the challenge has legal implications. Fleets could be found negligent by not acting on data in a timely manner that indicates a driver, or drivers, have an elevated accident risk.
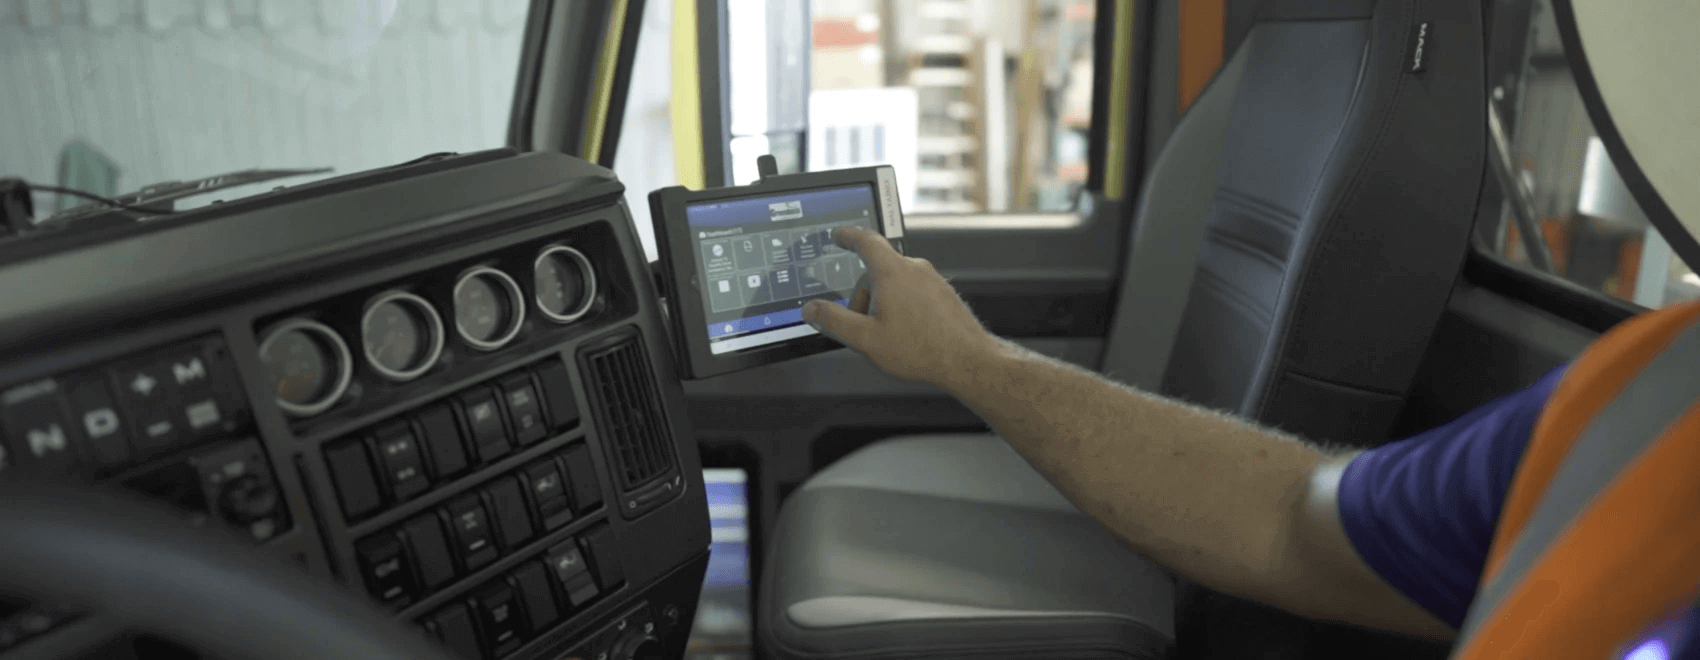
Recent developments have made it possible to gather driver data into a single database and apply real-time analysis, reporting and visibility tools for driver performance. A variety of hard-hitting metrics can be shared with drivers through easy-to-use scorecards in mobile apps that provide awareness and feedback to help improve their skills and results.
Motivating factors
Like most professionals, truck drivers want opportunities to showcase their talents and elevate their status in the workplace. Certainly, no one wants to see their name anywhere near the bottom of a list, but the real value of driver scorecards comes from building engagement and loyalty by recognizing and rewarding top performers.
When the technology is used in this manner, drivers are naturally motivated to do what it takes to move up in the rankings. Those who consistently underperform may need additional training or intervention to overcome bad habits and behaviors. Some may need to have their employment terminated to prevent accidents.
Metrics that matter
No two fleets operate the same. Driver scorecard metrics and the “drill down” paths for each metric to show drivers and managers what data contributed to the result can be tailored to individual needs.
Scorecard applications that can use data from a variety of sources will make it possible to customize the metrics and create applications that have the same look and functions for both managers and drivers.
Below are some examples of driver scorecard metrics that can be used, as is, or customized with additional datasets and calculations to achieve desires results:
| Fuel compliance | Accidents/incidents |
| Hours-of-Service violations | Speeding |
| Miles driven | Hard turns |
| Hard braking | MPG performance |
| Fuel consumption |
Fleets can set themselves apart by using metrics that matter to drivers and are specific to the type of culture they are trying to build and sustain.
Taking action
One of the most important features of a driver scorecard application is how information is presented to fleet managers according to their individual areas of responsibility.
Driver managers need to view the performance of drivers assigned to them and compare their overall results to other managers. A fleet safety manager needs a different view, such as a ranked list of drivers according to safety metrics. The manager also many need to look for trends and create custom reports to see how safety scores are trending for drivers that were hired within the last six months, for example.
Driver scorecard applications can provide these and other custom views for managers to monitor their own effectiveness and to evaluate ongoing training programs and campaigns. Reporting on historical data can show whether certain strategies to improve driver performance are working.

A genius idea
The possibilities to build engagement and deliver results with driver scorecards are virtually limitless. One way fleets can set themselves apart in the minds of drivers is to present scores in a select few categories that are calculated by using a mix of metrics from specific areas they want to measure.
As an example, a driver scorecard could have the following four categories. When drivers click on a score the application shows how they performed in more specific metrics.
- Economy: MPG, idle time, out-of-route miles.
- Safety: Harsh braking, cornering, speeding, accidents/incidents, seatbelt use, cell phone use (captured by an inward-facing camera).
- Compliance: Hours-of-service violations, DVIR completions, Driver Qualification files, MVR records.
- Operations: Preventable freight claims, on-time deliveries, completing online training assignments.
The ability to aggregate a variety of metrics from multiple sources and deliver a single, unified scorecard is a differentiating aspect of the Transflo Driver Scorecard. All data related to vehicle operations comes directly from the Transflo telematics device powered by Geotab. Additional data and metrics can be pulled into the Scorecard from any measurement system that motor carriers use.
If you want more “genius ideas” on how top motor carriers are using data to improve driver performance, be sure to join a free Transflo webinar on Oct. 7, 2021 at 2 p.m. EST: “5 Genius Ideas to Use Your Data.”
Register for the Webinar Now!


